
Going for Broke:
Time to Reform the UN Budget Process
WHITE PAPER by John Norris & Joshua Wells

PHOTO CREDIT: Pexels
MARCH 2026
Much of the discussions around the UN budget has focused on understandably pressing concerns: across the board cuts at most UN agencies; the failure of the United States and a number of other nations to pay dues on time or in full: the sharp drop in voluntary contributions in development and humanitarian relief: and potential savings through the UN80 reform process. But all of this is to focus on the trees while failing to see the forest. John Norris and Joshua Wells make the case that the UN’s budgeting process – the ‘who pays what’ that funds the world’s most important multilateral body – is fundamentally broken and badly in need of a major overhaul to bring it into the modern era. They propose a dramatically different funding formula as a model to consider.
Introduction
The United Nations faces a series of growing and potentially debilitating budget woes. UN Secretary-General António Guterres has maintained that the UN is at risk of “imminent financial collapse” due to late and unpaid dues. [1] Long-time UN expert John Hendra has made a compelling case that the UN is facing a budget “tsunami.” [2] The Economist lamented that the United States and China are pushing the UN “to the brink of financial collapse.” [3] And even recent suggestions that the United States will pay some or all of its back dues in the coming weeks seems unlikely to end these recurring cycles of budget peril.
Indeed, the urgency of the current budget crisis should not obscure the larger reality: the UN’s underlying budget process is broken and has been broken for some time. The current budget crunch is the manifestation of a system that has not made sense for decades. The core process for determining ‘who pays what’ in the UN’s budget is an archaic system whose central contours and formula have not changed significantly in 80 years, was not built for the functions and roles the UN currently carries out, and is in need of a fundamental overhaul.
These statements are not made lightly, and they are put forward with full recognition that getting 193 Member States to agree to anything, much less a new formula for determining contributions, is extraordinarily difficult in any environment, much less today. But we should also be clear about the alternative: a UN increasingly hobbled by budget woes with Member States unwilling to confront the realities of a modern world is a recipe for obsolesce – and possibly extinction. Achieving a better balance of power at the United Nations will require a new way of thinking about budgets.
Understanding How We Got Here
The foundations of the UN funding approach were set as the UN was formed in 1944, largely determined by the United States, the United Kingdom, and the Soviet Union at a time when those three nations were in a uniquely powerful position given the shifting tides in World War II. It was these three countries that set the core tenets of UN budgeting, which included mandatory financing, the capacity to pay, and giving the General Assembly supremacy on budget issues.
Importantly, contributions were based, with some tinkering over time, on the proportional share each country’s economy made up of the global total. This use of Gross National Income, or GNI, is comprised of the sum total of gross domestic product and income earned abroad. Locking in a funding formula based on a snapshot of the global economy in 1944 produced some major distortions from the onset and the distortions have only become more amplified over time.
The U.S. GNI was more than 40 percent of the global total at that particular moment, and UN membership at its inception was 51 Member States, a far cry from the 193 countries that are members of the United Nations today.
As Erin Graham points out in Transforming International Institutions: How Money Quietly Sidelined Multilateralism at The United Nations, the great powers that established the ground rules, including funding formulas, for they did not envision the United Nations as an implementing organization. The United Nations was viewed as a body for negotiation and coordination, not as a host of operational organizations carrying out work on the ground. Issues like social and economic development would be conducted by Member States themselves. The U.S., UK, and Soviet Union envisioned that they would directly carry out any required peacekeeping operations, and that they would not be funding the United Nations to undertake such missions.
Over the years, and through a series of international legal rulings and complex back and forth between Member States, several important trends emerged. The United Nations became an increasingly operational organization with budgets that reflected these operational activities in peacekeeping, development, and humanitarian relief. In addition, Member States increasingly channeled support to the United Nations through voluntary contributions, with these contributions frequently being earmarked for specific activities. The practices of states making voluntary contributions and earmarking funds for specific activities, while initially launched as budgetary workarounds with generally good intentions, ultimately contributed to a system that lost its moorings.
As the chart below makes clear, these earmarked voluntary contributions came to represent more than 50 percent of the UN’s budget in recent years. And while the hope always was that voluntary contributions would not undermine the core UN budget, the fact that the majority of UN operations are now reliant on voluntary contributions, largely from a handful of Member States, suggests what once seemed like an elegant work around has now become part of a larger pattern of budget dysfunction.
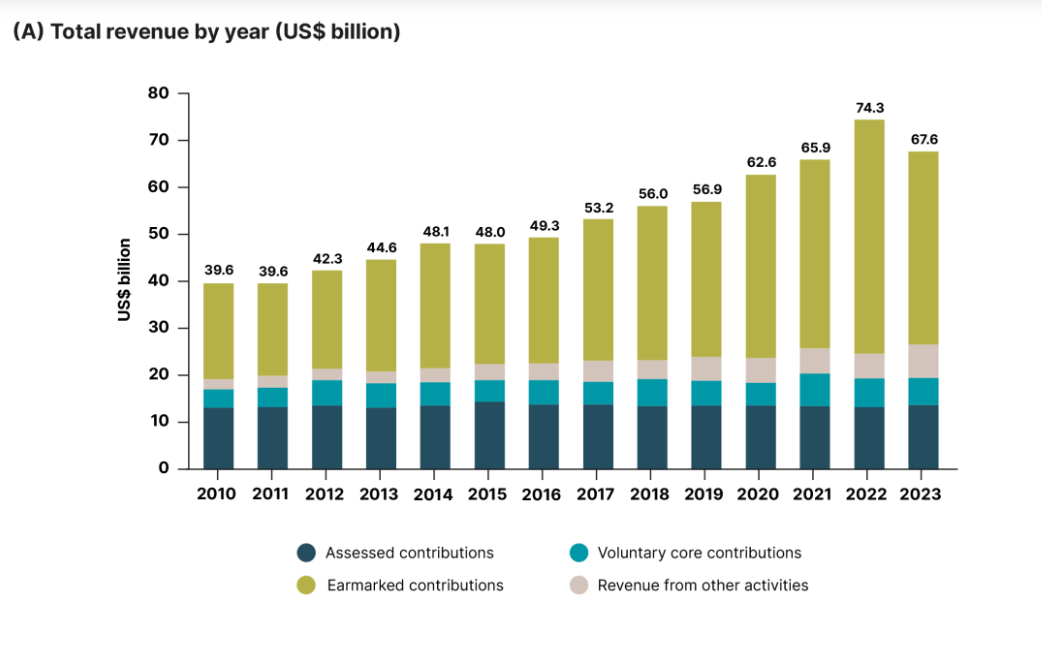
Credit: Dag Hammarskjold Foundation.
As Graham notes, donors used “trust funds (and sub-trust funds) as a substitute for aid that would traditionally be delivered through bilateral channels”, and the contracts governing these funds meant that “donors often exercised incredible control over the nature of funded projects.”
And, just as Member States came to see voluntary contributions as a way to fund those things they liked while avoiding those things they did not, withholding assessed contributions (or being chronically late in those payments) became a way for countries that make up a large portion of the overall UN budget to express their reservations with activities the UN was undertaking to which they objected.
During the presidency of Lyndon Johnson in 1965, the U.S. Ambassador the the United Nations Arthur Goldberg, frustrated with the tendency of other states to withhold or otherwise be late in paying their dues, made clear that the United States was also reserving the right to withhold funds when it wished to do so. In remarks that came to be known as the “Goldberg reservation,” the U.S. ambassador argued, “If any member can insist on making an exception to the principle of collective financial responsibility with respect to certain activities of the organization, the United States reserves the same option to make exceptions to the principles of collective financial responsibility if, in our view, strong and compelling reasons exist for doing so.” [4]
The precedent of the “Goldberg reservation” established de facto acceptance that a Member State must have a specific and compelling reason to withhold payments, but exactly who would determine the merits of those compelling and specific reasons was never satisfactorily resolved. And at different points, the United States, the former Soviet Union, China, and France have been substantially in arrears without ever losing their respective General Assembly votes.
And this is a crucial fact that clearly applies to the current moment: there is no effective enforcement mechanism that forces Member States to pay their assessed contributions, and certainly no reason they cannot turn on and off the taps of voluntary contributions as they see fit.
So, the reality of UN budgeting is that a smaller and smaller proportion of overall spending is covered by the UN regular budget: often less than 5 percent in recent years.
In essence, the founding budget principles of the UN budget – mandatory financing, the capacity to pay, and giving the General Assembly supremacy on budget issues – have become totally unmoored from the reality of how the UN finances its operations.
So let us return to the formula for who pays what in terms of assessed contributions.
The current process for determining the scale of assessments for the 2025-2027 period is based on the following formula:
Estimates of Gross National Income;
Conversation rates, based on market exchange rates;
The debt-burden approach, used in the scale of assessments for the period from 2022 to 2024;
A low per capita income adjustment of 80%, with a threshold per capital income limit of the average per capital gross national income of all Member States for the statistical base periods;
A minimum assessment rate of 0.001%;
A maximum assessment rate for the LDCs of 0.01%; and,
A maximum assessment rate of 22%.
An average statistical base period of three and six years.
This is all a very serious sounding set of formulas that have been negotiated at incredible length. In many ways its complexity is a feature not a bug but a Rube Goldberg device that tends to obscure some simple facts. Instead of looking at this complicated formula, let’s look at some data on what countries contributed to the United Nations in recent years.
Let’s look at 2024 numbers. The United Nations received a total of around $53 billion dollars in assessed, voluntary and other contributions from its Member States. [5]
The United States [6] total contributions were about $15.9 billion, some 31.1 percent of total UN funding that year.
Other large donors included: Germany at $5.2 billion (9.8 percent of the total); China at $3.6 billion (6.8 percent of the total); the United Kingdom at $3.4 billion (6.5 percent of the total); and, Japan at $2.8 billion (5.2 percent of the total). What is perhaps most notable with regard to China is its relatively meager voluntary contributions, which came in at around $265 million (in contrast to around $11 billion voluntary contributions from the United States, and close to $4 billion from Germany.)
It is illuminating to look at country contributions against their overall spending as governments. [7] For example, Saudi Arabia made a significant contribution of $591 million, but this was out of a total $350 billion government budget and some $78 billion spent on defense alone. Saudi Arabia contributed about 1.12 percent of total Member State contributions to the UN. China’s $3.6 billion in UN contributions come against an overall government budget of $3.6 trillion.
Bahrain's $15.9 million total contribution came out of the total government budget of $12 billion and accounted for .03 percent of total Member State Contributions.
Vietnam $13.2 million contribution came out of $120 billion government budget; Israel $108.6 million out of total government budget of $205 billion; Congo $6.9 million out of a total government budget of $20.3 billion; Iran $35.8 million out of $56 billion government budget; and India $233.3 million out of $600 billion.
In short, the dirty secret is that the United Nations is deeply reliant on a handful of contributors in a pattern of financing that is neither logical nor sustainable and bears little reflection of modern governance.
Why it Matters
The budget system that the UN currently has in place creates significant distortions that not only undercut general operational effectiveness but ultimately undermine the UN’s ability to achieve many of its core mandates.
The current approach, with the United States, Germany, China, UK, and Japan combining to provide 59.4 percent of overall UN funding, is remarkably undiversified. With 193 Member States, relying on just five for such a high-level of funding leaves the UN deeply vulnerable to the political whims in either Beijing, Berlin, Washington, London, and Tokyo. In the modern era, there is simply no reason why the United Nations shouldn’t have a much more diversified base of funding that ensures its vital operations can’t be effectively hamstrung if a single nation withholds its dues or voluntary contributions. The UN should diversify its funding for the same reasons that investors diversify their portfolios. It reduces risk and volatility, it hedges against different asset classes moving in different directions, and it smooths out returns to allow for more predictable budgeting.
Rebalance budgets, rebalance power. For years, Member States have understandably complained that the power structure within the United Nations is fundamentally unfair and under-values and under-represents countries that are not one of the five permanent members of the Security Council, or P5. While reforming the budget process would not eliminate the fact that only five countries are allowed a veto in the Security Council, it would give more and more countries a growing stake and say in UN operations and management in very practical ways. For years it has been accepted that certain states will have a disproportionate say in who heads what agencies and how they are staffed because they rely heavily on earmarked contributions from a single state. UN development efforts haven’t necessarily followed a pattern of investing in the highest ROI or most deserving projects, but have simply reflected where individual Member States are willing to sink significant funds. A more diversified, and we would argue fairer, approach to budgeting is an essential element of redistributing power within the United Nations so that it is genuinely multilateral in nature. It would also open the door to developing countries having greater say in shaping more effective approaches and ownership for development and peacebuilding efforts.
Skin in the game. There are far too many Member States whose donations to the United Nations are negligible. That may have been justified in 1944 as fires of World War II still burned, it is far less so today. It is rarely good practice to have diplomatic representatives voting on funding that is almost entirely comprised of other people’s money. Member States would very likely apply a much tougher lens to spending requests – from staff benefits to the creation of new agencies – if more of this funding was coming from their own governments and had to be defended to their own citizenries.
A Radical Rethink of Budgeting
The time has come for UN Member States to radically restructure its approach to budgeting. There are two key steps in this regard.
First, Member States should abandon GNI as the cornerstone of contributions.
A far better indicator would be the relative size of a country’s overall government’s spending. International relations and the diplomacy and programs carried out by the United Nations are ultimately a form of statecraft and budgeting for these activities should be determined by considering other government expenses by each Member State rather than a grand measure of total economic activity.
Shifting to government budgets as the baseline for determining assessments would be an important step toward bringing these calculations more into line with the actual ability of Member States to contribute and engage in meaningful burden sharing and returning to the foundational principle of “capacity to pay.”
A notional formula using overall government spending as a baseline for assessments is spelled out in more detail below.
But before turning to that is the key second point: Member States should significantly consolidate the UN’s diverse funding streams into a more unified budget and establish a cap where no UN agency can rely on more than 50 percent of voluntary contributions for its activities. Member States need to dramatically diminish the distinctions between assessed contributions, voluntary contributions, peacekeeping assessments, and other categories (with the obvious exception of donations from non-government sources.) Having the vast majority of the UN’s budget rely upon voluntary contributions and peacekeeping assessments is just a fiction to avoid the real question: If all the Member States support a specific activity, they should appropriately fund it.
But as it stands, only about 18 percent of all the UN’s income comes from assessed contributions, and a small handful of countries largely fund overall UN operations.
So, let’s explore a system based on national budgets. Here is what a nine-tier system based on overall government budgets might look like and would get UN operations to around the same $53 billion mark that we had in 2024. It is important to note that actual assessments would likely be significantly smaller once voluntary contributions were figured in. [8]
Tier One: United States and China
Each pay 10% of total Member States Costs: $5.3 billion
Total revenue: $10.6 billion
Tier Two: UK, Japan, France, Germany
Each pay 5% of total Member States Costs: $2.12 billion
Total revenue: $8.48 billion
Tier Three: Australia, Spain, Russia, India, Brazil, Canada, Italy
Each pay 2.5% of total Member States Costs: $1.325 billion
Total revenue: $9.275 billion
Tier Four: Austria, Sweden, Norway, Switzerland, Saudi Arabia, Belgium, Poland, Türkiye, Republic of Korea, Mexico, and the Netherlands
Each pay 1.5% of total Member States Costs: $795 million
Total revenue: $8.745 billion
Tier Five: Iraq, Romania, Colombia, Greece, Kuwait, Portugal, Czechia, UAE, Ireland, Finland, Israel, Argentina, Indonesia, Denmark
Each pay 0.5% of total Member States Costs: $265 million
Total revenue: $3.71 billion
Tier Six: Tanzania, Bolivia, Jordan, Guatemala, Costa Rica, Iceland, Côte d'Ivoire, Tunisia, Cyprus, Panama, Venezuela, Latvia, Estonia, Angola, Kenya, Dominican Republic, Azerbaijan, Uruguay, Nigeria, Uzbekistan, Libya, Belarus, Lithuania, Oman, Slovenia, Serbia, Peru, Bulgaria, Bangladesh, Croatia, Luxembourg, Morocco, Ecuador, Pakistan, Iran, Kazakhstan, Slovakia, Qatar, Egypt, Algeria, Malaysia, Chile, Vietnam, Ukraine, Philippines, New Zealand, Singapore, Hungary, South Africa, and Thailand.
Each pay 0.25% of total Member States Costs: $132.5 million
Total revenue: $6.625 billion
Tier Seven: Bahamas, Haiti, Brunei, Lebanon, Rwanda, Chad, Benin, Montenegro, Guinea, Tajikistan, Congo, Gabon, Guyana, Namibia, Mauritius, Burkina Faso, Mali, Zambia, Zimbabwe, Nicaragua, North Macedonia, Kyrgyzstan, Botswana, Papua New Guinea, Moldova, Sri Lanka, Armenia, Mozambique, Jamaica, Trinidad and Tobago, Senegal, Cambodia, Albania, Malta, Uganda, Paraguay, Nepal, Cameroon, Bahrain, Mongolia, Georgia, Honduras, El Salvador, Turkmenistan, DRC, Ethiopia, Myanmar, Bosnia and Herzegovina, Syria, Ghana.
Each pay 0.1% of total Member States Costs: $53 million
Total revenue: $2.65 billion
Tier Eight: Afghanistan, Zambia, El Salvador, Latvia, Honduras, Mali, Lao DPR, Lebanon, Bosnia and Herzegovina, Armenia, Estonia, Burkina Faso, Mongolia, Guyana, Albania, Benin, Cyprus, Madagascar, Nicaragua, Kyrgyzstan, Mozambique, Chad, Tajikistan, Gabon, Niger, Botswana, Rwanda, Trinidad and Tobago, Papua New Guinea, North Macedonia, Moldova, Congo, Brunei, Malawi, Malta, Mauritius, Mauritania, Jamaica, Haiti, Namibia, Equatorial Guinea, Iceland, Somalia, Togo, Sierra Leone, Montenegro, Burundi, Bahamas, Eswatini, Equatorial Guinea.
Each pay 0.05% of total Member States Costs: $26.5 million
Total revenue: $1.325 billion
Tier Nine: South Sudan, Maldives, Fiji, Suriname, Bhutan, Djibouti, Gambia, Liberia, Barbados, Guinea-Bissau, Lesotho, Andorra, Saint Lucia, Belize, Cabo Verde, Central African Republic, Timor-Leste, Antigua and Barbuda, Seychelles, Comoros, San Marino, Dominica, Grenada, Saint Kitts and Nevis, Saint Vincent and the Grenadines, Samoa, Sao Tome and Principe, Solomon Islands, Vanuatu, Kiribati, Marshal Islands, Micronesia, Nauru, Palau, Tonga, Tuvalu.
Each pay 0.005% of total Member States Costs: $2.65 million
Total revenue: $95.4 million
The reaction of all Member States will be of course to look at the proposed assessment rates above and calculate if they would be paying more or less than they are currently. That is, unfortunately, exactly the wrong question. Instead, Member States and outside observers should be asking the broader questions at the heart of this debate. How can we better share the costs associated with multilateralism fairly across more states to ensure a more stable and effective system? Are these proposed rates of assessment reasonable given the overall scope of a government’s total budget? Would a more equitable budget assessment encourage more effective power sharing across the UN’s operations?
Conclusion: With Power Comes Responsibility
The budget approach proposed in this paper is a theoretical construct. The UN’s budget problems, however, are quite real and are not going anywhere absent a fundamental change in approach by Member States. The time has come for a new approach.
Given the enormous strides forward in economic and social development since the UN’s founding, there is simply no compelling rationale for having the UN rely on just five member states for around 60 percent of its funding. If the UN’s Member States want the UN to serve as a legitimate vehicle for compromise, the promotion of peace and development, and as the epicenter of multilateral dialogue, they should embrace an approach to budgets and funding that will make those aspirations far more likely to be realized.
John Norris is a Senior Adviser at the Starling Institute. He has served in a variety of senior roles in government, international institutions, and nonprofits. Most recently, he was a Policy Adviser at the Gates Foundation. He earlier served as the Chief of Political Affairs for the United Nations Mission in Nepal. John is the author of four books, including a well-regarded biography of the journalist Mary McGrory and a history of the U.S. Agency for International Development.
Joshua Wells is a Research and Policy Analyst at the Starling Institute. He recently graduated with a B.A. from the Princeton School of Public and International Affairs. Josh was previously a 2023 Leonard D. Schaffer Fellow in Government Service for his work at the Office of the Governor of New Jersey and a 2022 Oscar S. Strauss II Fellow in Criminal Justice for his work at the New Jersey Institute for Social Justice.
NOTES AND REFERENCES
[1] https://www.reuters.com/world/un-chief-guterres-warns-imminent-financial-collapse-2026-01-30/
[2] https://www.daghammarskjold.se/publication/the-perfect-un-financing-storm-has-arrived-its-a-tsunami/
[3] https://www.economist.com/international/2025/05/01/the-un-could-run-out-of-cash-within-months
[4] https://www.govinfo.gov/content/pkg/CRPT-112hrpt323/html/CRPT-112hrpt323.html
[5] Author’s calculation, totaling each Member State’s assessed, voluntary, and revenue from other activities (from CEB data) and an estimation of each Member State’s peacekeeping contributions based on their 2024 effective rate (A/79/318/Add.1) and the 2024-2025 peacekeeping budget. The exact figure may differ. We omitted voluntary contributions to peacekeeping due to the lack of a reliable source. We also omitted contributions from disputed territories that are not UN Member States, i.e. Kosovo.
[6] In calculating each Member State’s contribution, we considered only contributions of the national government. Contributions from self-governing but non-sovereign territories were omitted. The UK figures, for example, do not include British Overseas Territories or Crown Dependencies. China’s total omits Hong Kong and Macau.
[7] IMF Data drawn from: https://en.wikipedia.org/wiki/List_of_countries_by_government_budget
[8] The base of this approach is quartiles of Member States based on government expenditure. Further divisions are applied when appropriate. The top quartile, for example, is broken down into five tiers to accommodate the substantial differences in expenditure among this group. Similarly, tier nine is formed from members of the final quartile with the lowest government budgets. We set a 10% ceiling on Member State contributions, to require the needed diversification, and a 0.005% floor to ensure adequate buy-in from all Member States.
All contributions in USD ($)
Appendix: Member State Data
| Member State | Assessed | % of regular budget | Total Voluntary | Earmarked Voluntary | Unearmarked Voluntary | Other Activities | Estimated Peacekeeping Contribution | Total Contribution with Peacekeeping |
|---|---|---|---|---|---|---|---|---|
| Afghanistan | 623,661 | 0.005 | 4,138,911 | 4,046,111 | 92,800 | 28,525 | 36,600 | 4,827,697 |
| Albania | 988,584 | 0.010 | 3,723,423 | 3,314,592 | 408,831 | 45,472 | 97,600 | 4,855,079 |
| Algeria | 9,353,644 | 0.087 | 16,648,473 | 5,656,391 | 10,992,082 | 5,746 | 1,329,800 | 27,337,663 |
| Andorra | 864,231 | 0.004 | 362,241 | 211,903 | 150,338 | 5,509 | 305,000 | 1,536,981 |
| Angola | 1,221,583 | 0.010 | 33,729,623 | 31,399,857 | 2,329,766 | 713,393 | 61,000 | 35,725,599 |
| Antigua and Barbuda | 463,881 | 0.002 | 340,871 | 339,711 | 1,160 | 12,799 | 36,600 | 854,151 |
| Argentina | 60,250,683 | 0.490 | 285,649,435 | 284,598,540 | 1,050,895 | 35,681,497 | 8,771,800 | 390,353,415 |
| Armenia | 921,708 | 0.007 | 1,160,958 | 300,261 | 860,697 | 27,406 | 85,400 | 2,195,472 |
| Australia | 292,788,188 | 2.040 | 376,469,275 | 338,658,745 | 37,810,530 | 9,858,084 | 128,771,000 | 807,886,547 |
| Austria | 95,810,945 | 0.626 | 157,658,857 | 134,276,836 | 23,382,021 | 548,472 | 41,419,000 | 295,437,274 |
| Azerbaijan | 3,081,244 | 0.034 | 14,870,312 | 14,442,400 | 427,912 | 117,457 | 366,000 | 18,435,013 |
| Bahamas | 4,168,329 | 0.015 | 236,661 | 217,661 | 19,000 | 9,765 | 1,073,600 | 5,488,355 |
| Bahrain | 7,429,850 | 0.050 | 5,471,122 | 5,318,732 | 152,390 | 8,914 | 3,050,000 | 15,959,886 |
| Bangladesh | 1,662,871 | 0.010 | 29,171,886 | 27,793,254 | 1,378,632 | 2,390,737 | 61,000 | 33,286,494 |
| Barbados | 1,125,147 | 0.007 | 2,179,951 | 102,702 | 2,077,249 | 167,952 | 195,200 | 3,668,250 |
| Belarus | 3,610,137 | 0.043 | 520,067 | 81,126 | 438,941 | 3,462 | 500,200 | 4,633,866 |
| Belgium | 118,939,635 | 0.773 | 180,245,612 | 108,792,147 | 71,453,465 | 798,965 | 50,508,000 | 350,492,212 |
| Belize | 364,204 | 0.001 | 599,032 | 101,673 | 497,359 | 2,422 | 12,200 | 977,858 |
| Benin | 652,120 | 0.005 | 895,331 | 0 | 895,331 | 377,024 | 30,500 | 1,954,975 |
| Bhutan | 283,278 | 0.001 | 842,825 | 568,351 | 274,474 | 107,016 | 6,100 | 1,239,219 |
| Bolivia | 1,884,052 | 0.018 | 9,844,673 | 9,664,673 | 180,000 | 369,911 | 231,800 | 12,330,436 |
| Bosnia and Herzegovina | 1,204,693 | 0.014 | 5,119,602 | 4,131,554 | 988,048 | 294,631 | 146,400 | 6,765,326 |
| Botswana | 1,611,609 | 0.013 | 2,933,402 | 2,543,443 | 389,959 | 238,504 | 183,000 | 4,966,515 |
| Brazil | 173,906,442 | 1.411 | 94,819,705 | 88,585,108 | 6,234,597 | 11,700,954 | 24,558,600 | 304,985,701 |
| Brunei | 2,958,985 | 0.019 | 293,232 | 153,520 | 139,712 | 61,441 | 1,183,400 | 4,497,058 |
| Bulgaria | 5,970,874 | 0.071 | 5,018,032 | 4,807,530 | 210,502 | 24,871 | 1,024,800 | 12,038,577 |
| Burkina Faso | 556,687 | 0.005 | 6,921,801 | 6,757,141 | 164,660 | 572,625 | 24,400 | 8,075,513 |
| Burundi | 249,646 | 0.001 | 18,580,159 | 18,268,062 | 312,097 | 249,325 | 6,100 | 19,085,230 |
| Cabo Verde | 292,807 | 0.001 | 405,035 | 11,905 | 393,130 | 21,618 | 12,200 | 731,660 |
| Cambodia | 949,448 | 0.008 | 4,636,050 | 4,380,973 | 255,077 | 249,883 | 42,700 | 5,878,081 |
| Cameroon | 1,711,155 | 0.014 | 30,547,763 | 28,829,356 | 1,718,407 | 1,059,494 | 158,600 | 33,477,012 |
| Canada | 365,129,333 | 2.543 | 1,412,007,392 | 1,142,155,694 | 269,851,698 | 13,757,531 | 160,308,000 | 1,951,202,256 |
| Central African Republic | 253,008 | 0.001 | 97,716,411 | 97,565,683 | 150,728 | 53,062 | 6,100 | 98,028,581 |
| Chad | 402,734 | 0.005 | 104,005,521 | 103,766,827 | 238,694 | 113,977 | 18,300 | 104,540,532 |
| Chile | 38,492,226 | 0.374 | 15,571,712 | 12,784,511 | 2,787,201 | 656,855 | 7,686,000 | 62,406,793 |
| China | 2,222,672,087 | 20.004 | 265,226,561 | 225,520,172 | 39,706,389 | 1,334,225 | 1,139,821,600 | 3,629,054,473 |
| Colombia | 21,362,217 | 0.197 | 188,290,286 | 187,905,292 | 384,994 | 3,386,913 | 3,001,200 | 216,040,616 |
| Comoros | 300,651 | 0.001 | 70,091 | 0 | 70,091 | 6,759 | 6,100 | 383,601 |
| Congo | 729,722 | 0.005 | 14,944,399 | 13,980,836 | 963,563 | 0 | 61,000 | 15,735,121 |
| Costa Rica | 6,122,247 | 0.063 | 1,697,362 | 1,496,986 | 200,376 | 22,054,955 | 841,800 | 30,716,364 |
| Côte d'Ivoire | 2,915,536 | 0.024 | 52,622,541 | 52,461,523 | 161,018 | 84,772 | 268,400 | 55,891,249 |
| Croatia | 9,009,377 | 0.088 | 3,290,652 | 3,220,704 | 69,948 | 140,281 | 1,665,300 | 14,105,610 |
| Cuba | 7,820,286 | 0.122 | 14,518,891 | 14,444,503 | 74,388 | 95,006 | 1,159,000 | 23,593,183 |
| Cyprus | 5,868,671 | 0.035 | 33,421,103 | 32,357,352 | 1,063,751 | 452,587 | 2,196,000 | 41,938,361 |
| Czechia | 40,177,953 | 0.344 | 10,274,840 | 9,890,682 | 384,158 | 135,555 | 12,444,000 | 63,032,348 |
| DPRK | 540,721 | 0.005 | 6,364,880 | 6,138,550 | 226,330 | 0 | 61,000 | 6,966,601 |
| DRC | 1,086,891 | 0.010 | 55,633,287 | 53,427,435 | 2,205,852 | 1,664,146 | 61,000 | 58,445,324 |
| Denmark | 79,023,271 | 0.531 | 710,703,681 | 587,562,592 | 123,141,089 | 8,720,758 | 33,733,000 | 832,180,710 |
| Djibouti | 300,784 | 0.002 | 3,239,095 | 2,882,750 | 356,345 | 79,874 | 6,100 | 3,625,853 |
| Dominica | 232,220 | 0.001 | 61,107,884 | 61,106,884 | 1,000 | 1,824,323 | 12,200 | 63,176,627 |
| Dominican Republic | 5,975,145 | 0.069 | 15,977,230 | 15,495,631 | 481,599 | 2,011,326 | 817,400 | 24,781,101 |
| Ecuador | 6,800,687 | 0.065 | 27,916,277 | 27,405,406 | 510,871 | 6,263,914 | 939,400 | 41,920,278 |
| Egypt | 12,311,182 | 0.182 | 46,526,360 | 45,585,251 | 941,109 | 1,234,143 | 1,695,800 | 61,767,485 |
| El Salvador | 1,397,474 | 0.013 | 7,542,225 | 7,542,225 | 0 | 405,399 | 158,600 | 9,503,698 |
| Equatorial Guinea | 1,149,097 | 0.008 | 1,967,540 | 778,304 | 1,189,236 | 172,331 | 146,400 | 3,435,368 |
| Eritrea | 221,110 | 0.001 | 1,239,831 | 1,063,160 | 176,671 | 408,722 | 6,100 | 1,875,763 |
| Estonia | 5,750,235 | 0.045 | 3,146,932 | 2,882,681 | 264,251 | 53,608 | 2,147,200 | 11,097,975 |
| Eswatini | 389,636 | 0.002 | 2,473,084 | 1,782,390 | 690,694 | 17,609 | 24,400 | 2,904,729 |
| Ethiopia | 1,182,609 | 0.010 | 6,293,255 | 5,354,772 | 938,483 | 12,241,426 | 61,000 | 19,778,290 |
| Fiji | 607,951 | 0.003 | 9,662,429 | 8,633,694 | 1,028,735 | 79,753 | 48,800 | 10,398,933 |
| Finland | 60,074,797 | 0.386 | 188,581,116 | 106,389,542 | 82,191,574 | 1,322,556 | 25,437,000 | 275,415,469 |
| France | 666,199,490 | 3.858 | 811,083,212 | 585,856,008 | 225,227,204 | 5,612,665 | 322,653,400 | 1,805,548,767 |
| Gabon | 1,494,071 | 0.011 | 6,523,171 | 5,330,728 | 1,192,443 | 34,004 | 158,600 | 8,209,846 |
| Gambia | 308,662 | 0.001 | 3,336,964 | 3,334,964 | 2,000 | 685 | 6,100 | 3,652,411 |
| Georgia | 1,011,070 | 0.009 | 3,407,005 | 2,570,971 | 836,034 | 4,902 | 97,600 | 4,520,577 |
| Germany | 855,960,166 | 5.692 | 3,832,696,416 | 3,288,737,409 | 543,959,007 | 94,578,915 | 372,771,000 | 5,156,006,497 |
| Ghana | 2,536,742 | 0.025 | 3,335,779 | 2,047,765 | 1,288,014 | 130,596 | 292,800 | 6,295,917 |
| Greece | 42,230,374 | 0.280 | 100,713,801 | 100,488,374 | 225,427 | 85,627 | 15,860,000 | 158,889,802 |
| Grenada | 214,970 | 0.001 | 9,358 | 1,175 | 8,183 | 4,166 | 12,200 | 240,694 |
| Guatemala | 3,769,544 | 0.046 | 63,602,566 | 62,723,565 | 879,001 | 38,790,432 | 500,200 | 106,662,742 |
| Guinea | 785,173 | 0.004 | 12,608,219 | 12,128,089 | 480,130 | 20,606 | 18,300 | 13,432,298 |
| Guinea-Bissau | 282,643 | 0.001 | 3,773,956 | 3,088,437 | 685,519 | 19,125 | 6,100 | 4,081,824 |
| Guyana | 584,297 | 0.011 | 1,759,978 | 332,365 | 1,427,613 | 1,828 | 48,800 | 2,394,903 |
| Haiti | 617,396 | 0.006 | 37,469,468 | 37,423,712 | 45,756 | 269,880 | 36,600 | 38,393,344 |
| Honduras | 1,087,626 | 0.010 | 116,581,858 | 116,581,858 | 0 | 5,107,894 | 109,800 | 122,887,178 |
| Hungary | 23,580,284 | 0.223 | 14,346,107 | 7,462,425 | 6,883,682 | 21,426 | 4,172,400 | 42,120,217 |
| Iceland | 5,117,400 | 0.035 | 65,646,365 | 48,333,899 | 17,312,466 | 224,883 | 2,196,000 | 73,184,648 |
| India | 92,154,824 | 1.106 | 126,147,042 | 93,706,416 | 32,440,626 | 2,309,596 | 12,736,800 | 233,348,262 |
| Indonesia | 45,955,879 | 0.579 | 25,718,702 | 19,198,651 | 6,520,051 | 1,652,998 | 6,697,800 | 80,025,379 |
| Iran | 30,225,238 | 0.386 | 1,043,321 | 992,227 | 51,094 | 64,093 | 4,526,200 | 35,858,852 |
| Iraq | 10,453,187 | 0.131 | 50,838,504 | 43,759,365 | 7,079,139 | 28,929 | 1,561,600 | 62,882,220 |
| Ireland | 66,350,475 | 0.472 | 299,501,790 | 224,995,078 | 74,506,712 | 1,248,907 | 26,779,000 | 393,880,172 |
| Israel | 73,677,791 | 0.609 | 679,886 | 679,886 | 0 | 58,026 | 34,221,000 | 108,636,703 |
| Italy | 448,924,841 | 2.813 | 639,639,777 | 535,281,981 | 104,357,796 | 15,571,268 | 194,529,000 | 1,298,664,886 |
| Jamaica | 963,950 | 0.007 | 2,479,195 | 147,436 | 2,331,759 | 238,351 | 97,600 | 3,779,096 |
| Japan | 1,116,604,892 | 6.930 | 1,129,580,209 | 974,437,407 | 155,142,802 | 49,745,316 | 490,013,000 | 2,785,943,417 |
| Jordan | 2,322,847 | 0.021 | 11,150,527 | 9,921,980 | 1,228,547 | 762,261 | 268,400 | 14,504,035 |
| Kazakhstan | 11,649,683 | 0.131 | 24,476,562 | 23,627,511 | 849,051 | 793,900 | 1,622,600 | 38,542,745 |
| Kenya | 3,236,001 | 0.037 | 14,226,538 | 12,431,997 | 1,794,541 | 99,220 | 366,000 | 17,927,759 |
| Kiribati | 173,654 | 0.001 | 6,181 | 181 | 6,000 | 2,393 | 6,100 | 188,328 |
| Kuwait | 31,690,747 | 0.222 | 48,860,934 | 45,706,322 | 3,154,612 | 352,646 | 13,206,500 | 94,110,827 |
| Kyrgyzstan | 443,176 | 0.003 | 327,629 | 0 | 327,629 | 6,499 | 24,400 | 801,704 |
| Lao DPR | 703,392 | 0.006 | 7,719,259 | 7,376,831 | 342,428 | 3,541 | 42,700 | 8,468,892 |
| Latvia | 5,197,095 | 0.050 | 1,248,642 | 1,162,533 | 86,109 | 247,918 | 1,220,000 | 7,913,655 |
| Lebanon | 3,070,707 | 0.022 | 15,921,675 | 15,400,945 | 520,730 | 6,226,124 | 439,200 | 25,657,706 |
| Lesotho | 253,165 | 0.001 | 4,983,179 | 4,477,943 | 505,236 | 71,851 | 6,100 | 5,314,295 |
| Liberia | 6,714,554 | 0.001 | 2,032,585 | 1,972,585 | 60,000 | 45,499 | 6,100 | 8,798,738 |
| Libya | 1,691,815 | 0.040 | 4,649,753 | 4,639,753 | 10,000 | 141,854 | 219,600 | 6,703,022 |
| Liechtenstein | 1,450,332 | 0.009 | 4,181,783 | 3,521,744 | 660,039 | 64,876 | 610,000 | 6,306,991 |
| Lithuania | 8,059,843 | 0.081 | 1,972,434 | 1,617,350 | 355,084 | 3,123 | 1,878,800 | 11,914,200 |
| Luxembourg | 11,144,219 | 0.073 | 116,757,229 | 93,641,514 | 23,115,715 | 358,706 | 4,148,000 | 132,408,154 |
| Madagascar | 558,327 | 0.004 | 2,190,695 | 2,101,008 | 89,687 | 84,495 | 24,400 | 2,857,917 |
| Malawi | 336,794 | 0.003 | 21,736,400 | 21,599,250 | 137,150 | 4,006,152 | 12,200 | 26,091,546 |
| Malaysia | 30,475,210 | 0.326 | 10,977,791 | 6,254,076 | 4,723,715 | 205,375 | 4,245,600 | 45,903,976 |
| Maldives | 546,352 | 0.004 | 5,398,273 | 5,384,373 | 13,900 | 31,061 | 48,800 | 6,024,486 |
| Mali | 629,867 | 0.005 | 33,714,281 | 33,450,071 | 264,210 | 662,957 | 30,500 | 35,037,605 |
| Malta | 5,043,726 | 0.020 | 1,718,805 | 1,529,320 | 189,485 | 149,191 | 1,159,000 | 8,070,722 |
| Marshal Islands | 4,952,876 | 0.001 | 1,922,522 | 1,922,522 | 0 | 65,691 | 12,200 | 6,953,289 |
| Mauritania | 354,851 | 0.003 | 3,223,868 | 2,953,258 | 270,610 | 285,519 | 12,200 | 3,876,438 |
| Mauritius | 1,874,436 | 0.010 | 1,327,983 | 1,257,483 | 70,500 | 192,899 | 231,800 | 3,627,118 |
| Mexico | 107,140,708 | 1.137 | 28,020,145 | 26,451,630 | 1,568,515 | 3,078,949 | 14,896,200 | 153,136,002 |
| Micronesia | 158,163 | 0.001 | 35,921 | 136 | 35,785 | 0 | 12,200 | 206,284 |
| Monaco | 1,711,504 | 0.011 | 8,655,434 | 8,304,929 | 350,505 | 118,149 | 671,000 | 11,156,087 |
| Mongolia | 659,297 | 0.004 | 1,530,431 | 1,181,169 | 349,262 | 149,366 | 48,800 | 2,387,894 |
| Montenegro | 581,306 | 0.004 | 7,185,504 | 6,891,996 | 293,508 | 506,966 | 48,800 | 8,322,576 |
| Morocco | 6,183,095 | 0.059 | 31,858,075 | 30,587,106 | 1,270,969 | 625,323 | 671,000 | 39,337,493 |
| Mozambique | 550,273 | 0.002 | 38,570,196 | 38,242,982 | 327,214 | 895,322 | 24,400 | 40,040,191 |
| Myanmar | 1,063,311 | 0.010 | 213,184 | 13,220 | 199,964 | 491,535 | 61,000 | 1,829,030 |
| Namibia | 1,052,941 | 0.007 | 1,489,864 | 338,338 | 1,151,526 | 203,682 | 109,800 | 2,856,287 |
| Nauru | 178,840 | 0.001 | 1,201 | 126 | 1,075 | 0 | 18,300 | 198,341 |
| Nepal | 920,457 | 0.010 | 192,996 | 0 | 192,996 | 152,313 | 61,000 | 1,326,766 |
| Netherlands | 198,498,523 | 1.298 | 766,876,745 | 546,115,634 | 220,761,111 | 12,445,316 | 83,997,000 | 1,061,817,584 |
| New Zealand | 43,204,321 | 0.302 | 81,990,474 | 75,893,691 | 6,096,783 | 1,787,162 | 18,849,000 | 145,830,957 |
| Nicaragua | 704,258 | 0.004 | 81,364 | 21,364 | 60,000 | 924,259 | 61,000 | 1,770,881 |
| Niger | 425,239 | 0.004 | 411,604 | 0 | 411,604 | 172,961 | 18,300 | 1,028,104 |
| Nigeria | 16,723,206 | 0.150 | 36,715,613 | 34,329,900 | 2,385,713 | 255,203 | 2,220,400 | 55,914,422 |
| North Macedonia | 894,167 | 0.008 | 4,361,694 | 4,353,434 | 8,260 | 310,200 | 85,400 | 5,651,461 |
| Norway | 97,710,429 | 0.653 | 1,104,210,152 | 780,198,864 | 324,011,288 | 11,047,006 | 41,419,000 | 1,254,386,587 |
| Oman | 10,900,629 | 0.115 | 7,268,967 | 6,955,378 | 313,589 | 642,198 | 2,708,400 | 21,520,194 |
| Pakistan | 10,158,496 | 0.123 | 315,710,546 | 304,685,011 | 11,025,535 | 5,505,224 | 1,390,800 | 332,765,066 |
| Palau | 294,832 | 0.001 | 1,117 | 117 | 1,000 | 3,346 | 24,400 | 323,695 |
| Panama | 14,844,396 | 0.086 | 66,753,546 | 65,509,343 | 1,244,203 | 27,826,386 | 1,647,000 | 111,071,328 |
| Papua New Guinea | 1,186,305 | 0.009 | 1,452,156 | 254,954 | 1,197,202 | 27,467 | 122,000 | 2,787,928 |
| Paraguay | 2,590,536 | 0.023 | 31,008,209 | 30,964,005 | 44,204 | 1,749,480 | 317,200 | 35,665,425 |
| Peru | 14,121,517 | 0.145 | 63,278,585 | 62,007,795 | 1,270,790 | 1,457,897 | 1,988,600 | 80,846,599 |
| Philippines | 18,218,008 | 0.198 | 12,066,617 | 10,317,707 | 1,748,910 | 3,178,760 | 2,586,400 | 36,049,785 |
| Poland | 80,449,663 | 0.831 | 21,982,121 | 19,447,794 | 2,534,327 | 273,176 | 15,317,100 | 118,022,060 |
| Portugal | 50,079,161 | 0.328 | 27,812,980 | 14,382,031 | 13,430,949 | 251,650 | 21,533,000 | 99,676,791 |
| Qatar | 36,756,488 | 0.245 | 125,507,172 | 51,464,371 | 74,042,801 | 957,305 | 15,176,800 | 178,397,765 |
| RoK | 355,407,659 | 2.349 | 912,982,959 | 817,837,291 | 95,145,668 | 10,538,045 | 157,014,000 | 1,435,942,663 |
| Moldova | 716,690 | 0.006 | 1,180,998 | 755,951 | 425,047 | 53,902 | 61,000 | 2,012,590 |
| Romania | 30,281,170 | 0.358 | 3,837,310 | 3,472,210 | 365,100 | 26,617 | 5,709,600 | 39,854,697 |
| Russia | 284,786,075 | 2.094 | 25,954,370 | 24,592,882 | 1,361,488 | 1,610,461 | 139,433,800 | 451,784,706 |
| Rwanda | 458,181 | 0.003 | 298,137 | 191,014 | 107,123 | 135,360 | 18,300 | 909,978 |
| Saint Kitts and Nevis | 387,875 | 0.001 | 21,232 | 19,232 | 2,000 | -2,370 | 73,200 | 479,937 |
| Saint Lucia | 309,775 | 0.002 | 4,285 | 2,285 | 2,000 | 16,963 | 24,400 | 355,423 |
| Saint Vincent and the Grenadines | 260,668 | 0.001 | 71,173 | 59,399 | 11,774 | 1,275 | 12,200 | 345,316 |
| Samoa | 236,605 | 0.001 | 339,208 | 6,948 | 332,260 | 0 | 12,200 | 588,013 |
| San Marino | 528,512 | 0.002 | 108,305 | 108,305 | 0 | 0 | 122,000 | 758,817 |
| Sao Tome and Principe | 186,886 | 0.001 | 4,121,327 | 4,077,827 | 43,500 | 44,069 | 6,100 | 4,358,382 |
| Saudi Arabia | 153,094,111 | 1.217 | 367,948,154 | 332,224,707 | 35,723,447 | 3,927,365 | 66,807,200 | 591,776,830 |
| Senegal | 1,114,132 | 0.007 | 2,343,703 | 0 | 2,343,703 | 85,740 | 42,700 | 3,586,275 |
| Serbia | 2,939,664 | 0.040 | 45,164,591 | 43,862,295 | 1,302,296 | 11,995,259 | 390,400 | 60,489,914 |
| Seychelles | 348,809 | 0.002 | 962,544 | 872,919 | 89,625 | 66,000 | 36,600 | 1,413,953 |
| Sierra Leone | 344,585 | 0.001 | 34,778,087 | 34,394,087 | 384,000 | 375,194 | 6,100 | 35,503,966 |
| Singapore | 70,463,027 | 0.479 | 3,497,562 | 3,263,434 | 234,128 | 201,112 | 28,438,200 | 102,599,901 |
| Slovakia | 18,418,005 | 0.149 | 15,475,361 | 15,225,915 | 249,446 | 434,263 | 5,673,000 | 40,000,629 |
| Slovenia | 11,493,546 | 0.077 | 10,744,435 | 8,644,208 | 2,100,227 | 16,979 | 4,819,000 | 27,073,960 |
| Solomon Islands | 220,155 | 0.001 | 64,082 | 52,629 | 11,453 | 5,098 | 6,100 | 295,435 |
| Somalia | 237,989 | 0.002 | 230,683,931 | 230,225,871 | 458,060 | 4,296 | 6,100 | 230,932,316 |
| South Africa | 23,564,079 | 0.251 | 7,691,030 | 5,491,248 | 2,199,782 | 562,019 | 2,976,800 | 34,793,928 |
| South Sudan | 270,801 | 0.005 | 171,882,941 | 171,322,203 | 560,738 | 4,927 | 12,200 | 172,170,869 |
| SPain | 300,409,285 | 1.895 | 225,737,444 | 166,671,801 | 59,065,643 | 1,001,494 | 130,174,000 | 657,322,223 |
| Sri Lanka | 4,055,418 | 0.038 | 1,334,492 | 906,606 | 427,886 | 192,347 | 549,000 | 6,131,257 |
| Sudan | 893,953 | 0.008 | 14,432,731 | 14,311,331 | 121,400 | 156,926 | 61,000 | 15,544,610 |
| Suriname | 488,350 | 0.002 | 819,808 | 794,368 | 25,440 | 82 | 36,600 | 1,344,840 |
| Sweden | 124,280,361 | 0.822 | 816,844,086 | 675,248,658 | 141,595,428 | 13,591,907 | 53,131,000 | 1,007,847,354 |
| Switzerland | 164,498,974 | 1.029 | 490,400,345 | 420,105,760 | 70,294,585 | 8,722,102 | 69,174,000 | 732,795,421 |
| Syria | 929,027 | 0.006 | 1,558,903 | 1,505,523 | 53,380 | 0 | 109,800 | 2,597,730 |
| Tajikistan | 462,497 | 0.003 | 9,996,154 | 9,520,418 | 475,736 | 53,836 | 36,600 | 10,549,087 |
| Thailand | 32,757,162 | 0.341 | 9,948,764 | 5,674,471 | 4,274,293 | 661,011 | 4,489,600 | 47,856,537 |
| Timor-Leste | 256,072 | 0.001 | 4,231,666 | 3,661,974 | 569,692 | 220,278 | 6,100 | 4,714,116 |
| Togo | 438,406 | 0.002 | 527,402 | 111,088 | 416,314 | 26,174 | 12,200 | 1,004,182 |
| Tonga | 212,933 | 0.001 | 441,143 | 136 | 441,007 | 0 | 12,200 | 666,276 |
| Trinidad and Tobago | 3,939,717 | 0.033 | 2,501,703 | 2,007,293 | 494,410 | 312,144 | 902,800 | 7,656,364 |
| Tunisia | 2,297,371 | 0.018 | 1,156,143 | 496,828 | 659,315 | 286,951 | 231,800 | 3,972,265 |
| Turkiye | 70,385,609 | 0.685 | 86,176,629 | 67,805,441 | 18,371,188 | 1,654,093 | 10,309,000 | 168,525,331 |
| Turkmenistan | 2,921,405 | 0.036 | 52,661,759 | 52,359,600 | 302,159 | 2,871,025 | 414,800 | 58,868,989 |
| Tuvalu | 192,218 | 0.001 | 1,536 | 181 | 1,355 | 0 | 6,100 | 199,854 |
| Uganda | 1,011,192 | 0.010 | 10,134,170 | 8,744,901 | 1,389,269 | 87,419 | 61,000 | 11,293,781 |
| Ukraine | 5,677,963 | 0.074 | 791,237 | 0 | 791,237 | 9,933 | 683,200 | 7,162,333 |
| UAE | 84,092,755 | 0.574 | 210,820,529 | 209,149,495 | 1,671,034 | 2,073,543 | 35,831,400 | 332,818,227 |
| UK | 667,614,103 | 3.991 | 2,407,184,909 | 2,002,639,756 | 404,545,153 | 12,324,541 | 326,911,200 | 3,414,034,753 |
| Tanzania | 1,113,091 | 0.010 | 7,708,344 | 6,701,095 | 1,007,249 | 1,113,371 | 61,000 | 9,995,806 |
| USA | 3,213,951,085 | 22.000 | 10,952,820,750 | 10,486,500,519 | 466,320,231 | 98,764,408 | 1,643,907,300 | 15,909,443,543 |
| Uruguay | 9,191,177 | 0.079 | 45,950,432 | 45,594,982 | 355,450 | 3,275,488 | 2,244,800 | 60,661,897 |
| Uzbekistan | 2,440,864 | 0.024 | 11,101,845 | 9,838,379 | 1,263,466 | 12,683,015 | 329,400 | 26,555,124 |
| Vanuatu | 326,335 | 0.001 | 68,796 | 67,386 | 1,410 | 0 | 12,200 | 407,331 |
| Venezuela | 15,212,766 | 0.069 | 1,091,776 | 701,686 | 390,090 | 40,617 | 2,135,000 | 18,480,159 |
| Viet Nam | 10,438,625 | 0.159 | 1,676,192 | 1,110,997 | 565,195 | 2,438 | 1,134,600 | 13,251,855 |
| Yemen | 753,523 | 0.003 | 216,997 | 216,997 | 0 | 4,099 | 48,800 | 1,023,419 |
| Zambia | 842,574 | 0.006 | 9,632,260 | 8,047,978 | 1,584,282 | 426,641 | 48,800 | 10,950,275 |
| Zimbabwe | 1,022,733 | 0.007 | 25,738,102 | 24,583,355 | 1,154,747 | 1,127,417 | 85,400 | 27,973,652 |